Using the Moving Average
One of the easiest indicators to understand, the moving average shows the average value of a security's price over a period of time. To find the 50 day moving average, you would add up the closing prices (but not always, we'll explain later) from the past 50 days and divide them by 50. Because prices are constantly changing, the moving average will move as well. It should also be noted that moving averages are most often used when compared or used in conjunction with other indicators such as MACD (Moving Average Convergence/Divergence) and EMA (Exponential Moving Average).
The most commonly used moving averages are of 20, 30, 50, 100, and 200 days. Each moving average provides a different interpretation on what the stock will do, there is not one right time frame. The longer the time span, the less sensitive the moving average will be to daily price changes. Moving averages are used to emphasize the direction of a trend and smooth out price and volume fluctuations (or "noise") that can confuse interpretation.
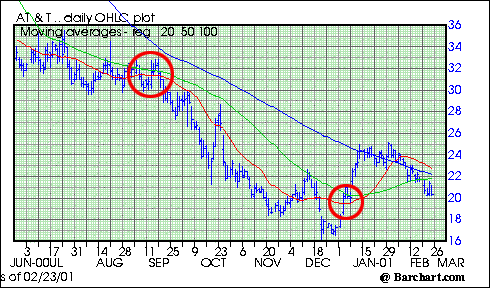
Here is a visual example using the stock price of AT&T:
 This chart was supplied by Barchart.com
Notice in September when the stock price dropped well below its 50 day average (the green line). There was a steady downward trend since then and no real strong divergence until the end of December where it rose above its 50 day average and continued to rise for several weeks.
Typically, when a stock price moves below its moving average it is a bad sign because the stock is moving on a negative trend. The opposite is true for stocks that move above their moving average.