Popular Charting Patterns
Many believe that history repeats itself. Successful and proven price patterns from great stocks are widely used by technical analysts. Let's take a look at a few examples:
-
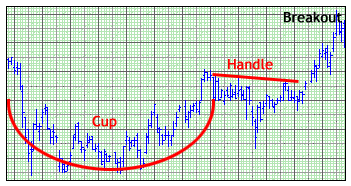
Cup and Handle - This is a pattern on a bar chart that can be as short as 7 weeks and as long as 65 weeks. The cup is in the shape of a U. The handle has a slight downward drift. The right hand side of the pattern has low trading volume. As the stock comes up to test the old highs, it will incur selling pressure by the people who bought at or near the old high. This selling pressure will make the stock price trade sideways with a tendency towards a downtrend for 4 days to 4 weeks, then it takes off.
It looks like a pot with handle. Investors have made a lot of money using this pattern, which is one of the easier to detect.
-
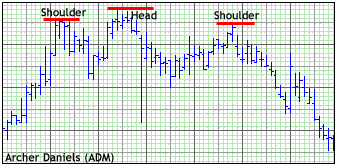
Head and Shoulders - A chart formation that resembles an "M" in which a stock's price:
- rises to a peak and then declines, then
- rises above the former peak and again declines, and then
- rises again but not to the second peak and again declines.
The first and third peaks are shoulders, and the second peak forms the head. This pattern is considered a very bearish indicator.
-
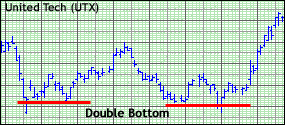
Double Bottom - Occurs when a stock price drops to a similar price level twice within a few weeks or months, the double-bottom pattern resembles a "W". A buy signal is triggered when the price passes the highest point in the handle. In a perfect double bottom, the second decline should normally go slightly lower than the first decline to create a shakeout of jittery investors. The middle point of the "W" should not go into new high ground. This is a very bullish indicator.
The belief is that after two drops in the stock price the jittery investors are out and long-term investors are still holding on.