Technical Analysis
Technical analysis is the polar opposite of fundamental analysis , which is the basis of every method explored so far in this tutorial. Technical analysts, or technicians, select stocks by analyzing statistics generated by past market activity, prices, and volumes. Sometimes also known as chartists , technical analysts look at the past charts of prices and different indicators to make inferences about the future movement of a stock's price.
Philosophy of Technical Analysis
In his book, Charting Made Easy, technical analysis guru John Murphy introduces readers to the study of technical analysis, explaining its basic premises and tools. Here he explains the underlying theories of technical analysis:
Chart analysis (also called technical analysis) is the study of market action, using price charts, to forecast future price direction. The cornerstone of the technical philosophy is the belief that all factors that influence market price–fundamental information, political events, natural disasters, and psychological factors–are quickly discounted in market activity. In other words, the impact of these external factors will quickly show up in some form of price movement, either up or down.
The most important assumptions that all technical analysis techniques are based upon can be summarized as follows:
- Prices already reflect, or 'discount', relevant information. In other words, markets are efficient.
- Prices move in trends.
- History repeats itself.
What Technical Analysts Don't Care About
Pure technical analysts couldn't care less about the elusive intrinsic value of a company or any other factors that preoccupy fundamental analysts, such as managements, business models , or competition. Technicians are concerned with the trends implied by past data, charts, and indicators, and they often make a lot of money trading companies they know almost nothing about.
Is Technical Analysis a Long-Term Strategy?
The answer to the question above is no. Definitely not. Technical analysts are usually very active in their trades, holding positions for short periods in order to capitalize on fluctuations in price, whether up or down. A technical analyst may go short or long on a stock, depending on what direction the data is saying the price will move.
If a stock does not perform the way a technician thought it would, he or she wastes little time deciding whether to exit his or her position, using stop loss orders to mitigate losses. Whereas a value investor must exercise a lot of patience and wait for the market to correct its undervaluation of a company, the technician must possess a great deal of trading agility and know how to get in and out of positions with speed.
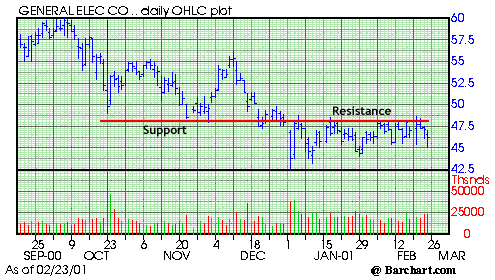
Support and Resistance
Among the most important concepts in technical analysis are support and resistance . These are the levels at which technicians expect a stock to start increasing after a decline (support), or to begin decreasing after an increase (resistance). Trades are generally entered around these important levels because they indicate the way in which a stock will bounce. They will enter into a long position if they feel a support level has been hit, or enter into a short position if they feel a resistance level has been struck.
Picking Stocks with Technical Analysis
Technicians have a very full toolbox. They literally have hundreds of indicators and chart patterns to use for picking stocks. However, it is important to note that no one indicator or chart pattern is infallible or absolute; the technician must interpret indicators and patterns, and this process is more subjective than formulaic. Let's briefly examine a couple of the most popular chart patterns (of price) that technicians analyze.
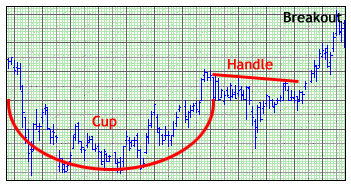
Cup and Handle
This is a bullish pattern that looks like a pot with a handle. The stock price is expected to break out at the end of the handle, so by buying here, investors are able to make a lot of money. Another reason for this pattern's popularity is how easy it is to spot.
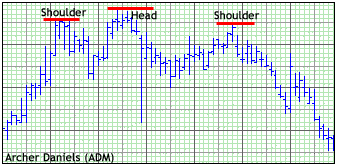
Head and Shoulders
This pattern resembles, well, a head with two shoulders. Technicians usually consider this a bearish pattern.
Remember, these two examples are mere glimpses into the vast world of technical analysis and its techniques. We couldn't have a complete stock picking tutorial without mentioning technical analysis, but this brief intro barely scratches the surface.
Conclusion
Technical analysis is unlike any other stock picking strategy–it has its own set of concepts, and it relies on a completely different set of criteria than any strategy employing fundamental analysis. However, regardless of its analytical approach, mastering technical analysis requires discipline and savvy, just like any other strategy.