All trading basics

Moving Averages (EMA7, 27) A Month Later…

Last month I discussed a basic technical analysis technique: that of two exponential moving averages (EMA), one of which is calculated in the medium term and the other in the long term. The article referred to six stocks that had just given a long-term (weekly) buy signal (on January 6, the date of writing) and seven stocks that had just given a medium-term (daily) buy signal.

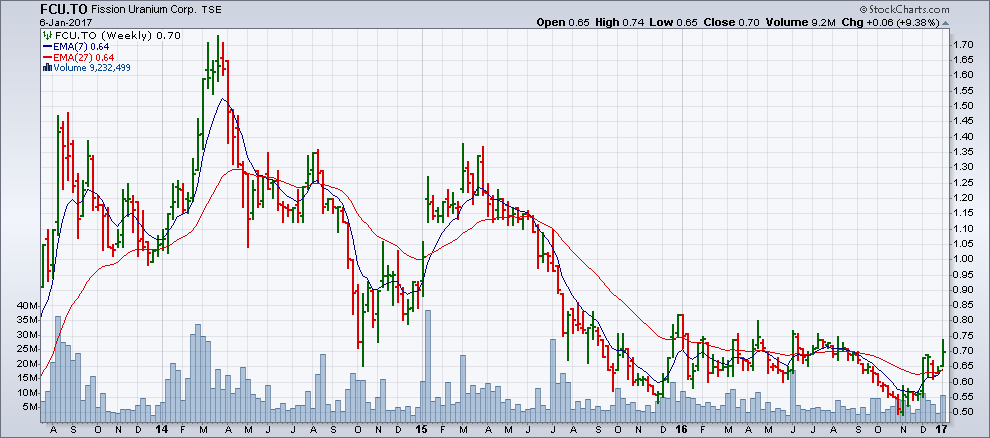
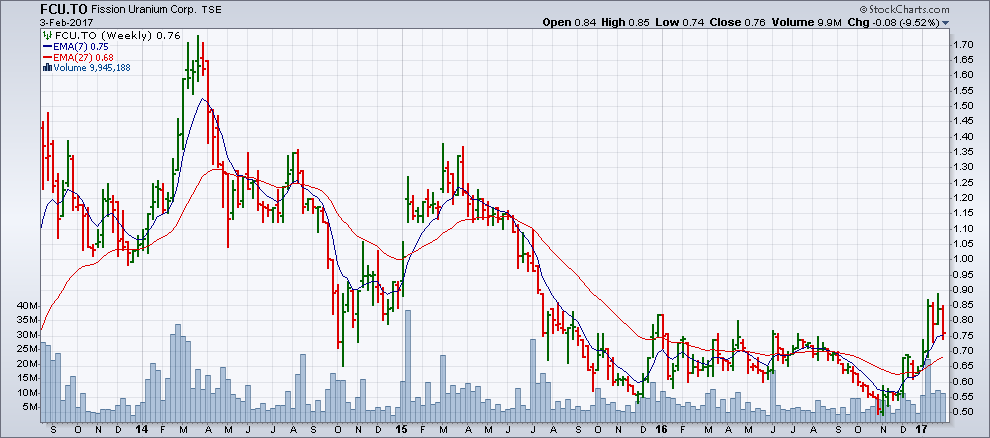
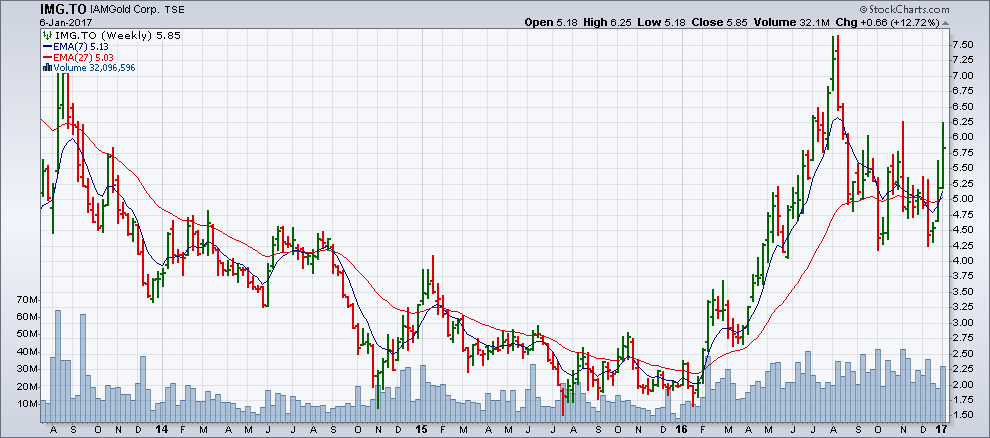
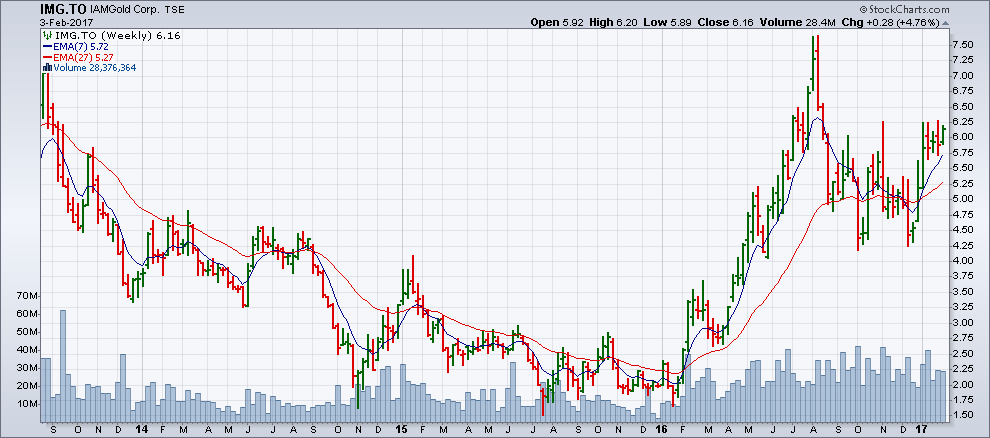
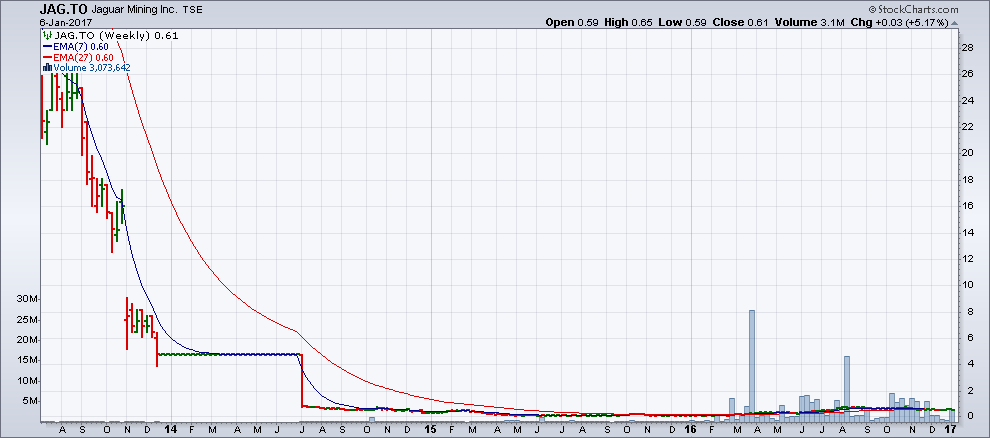
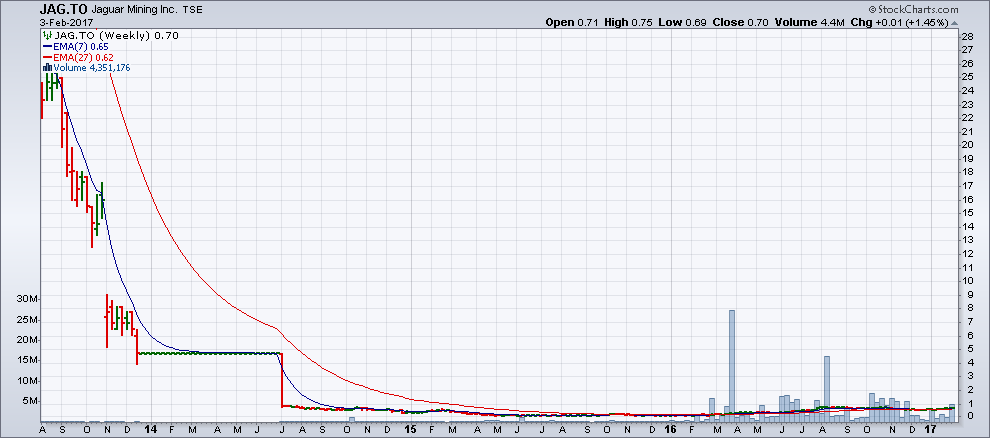
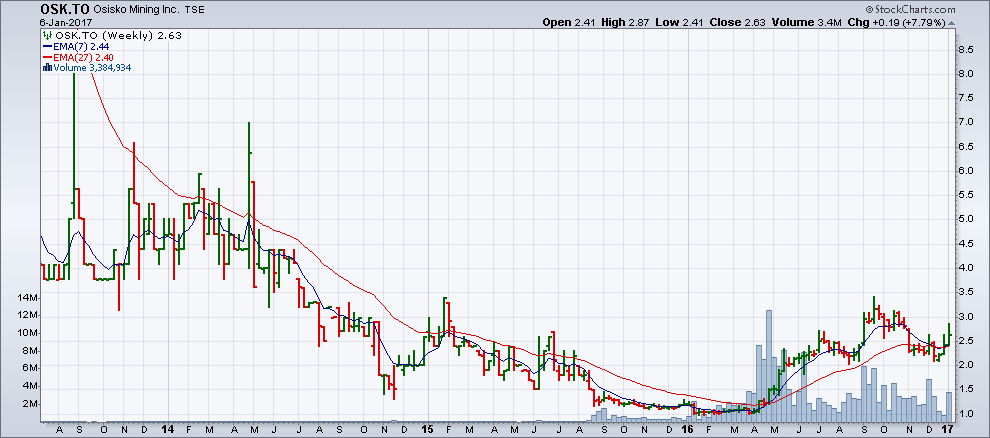
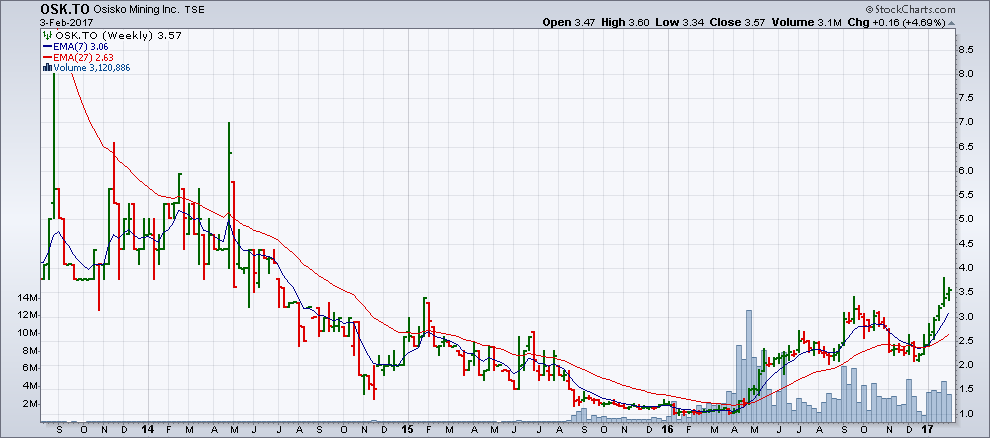
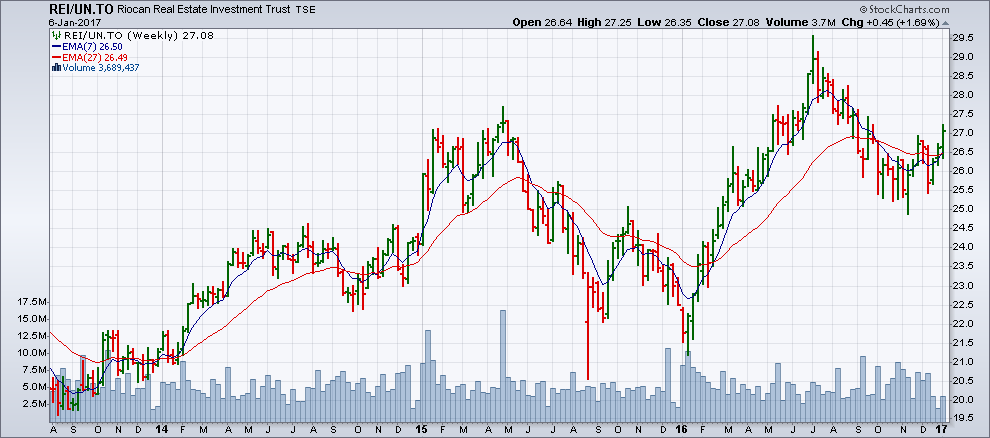
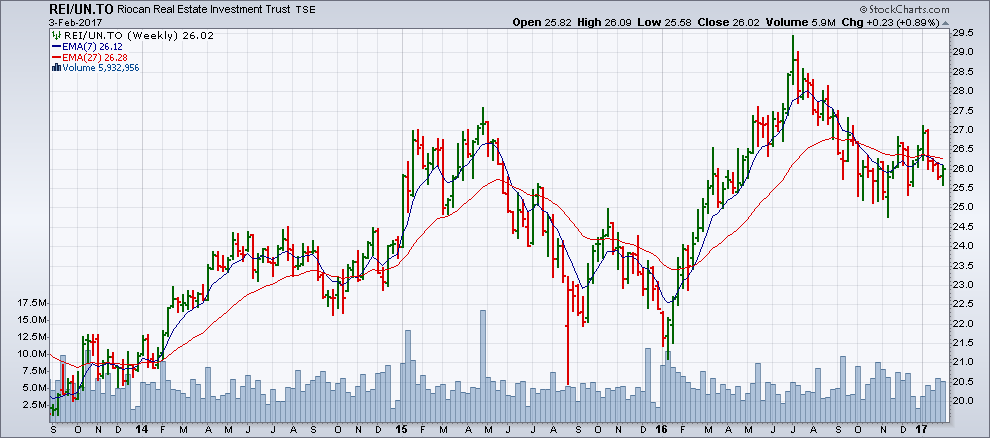
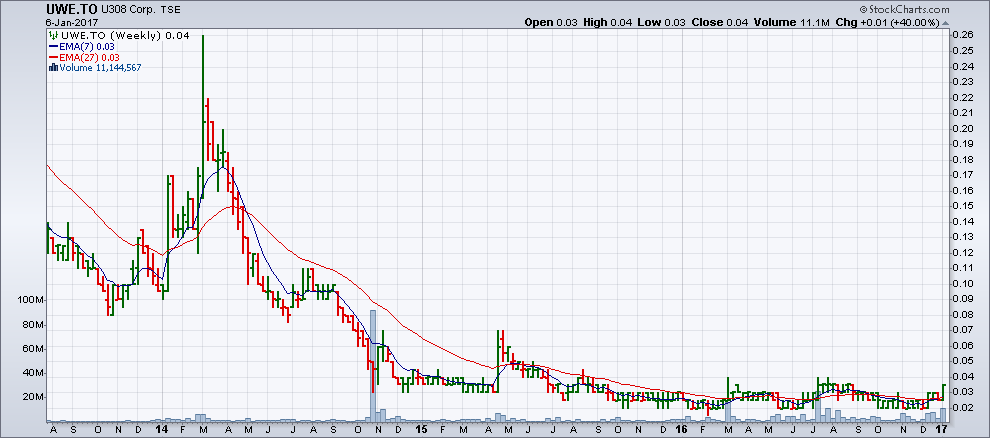
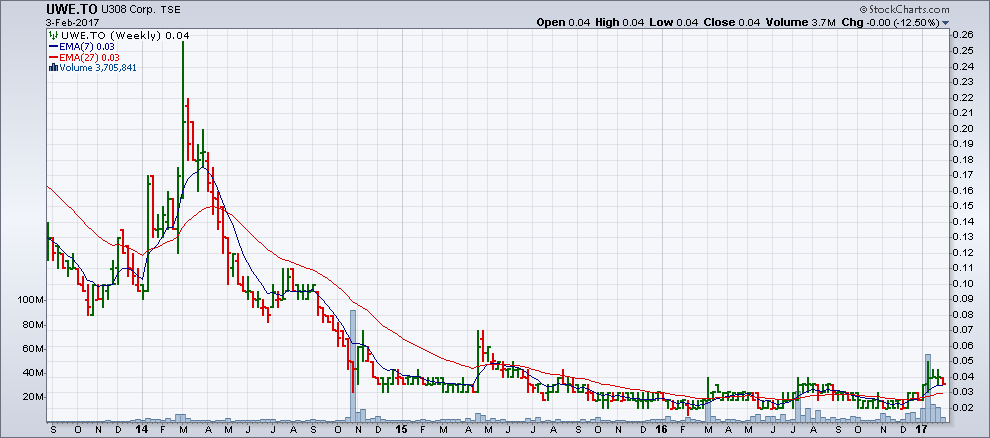
Weekly buy signals (each bar represents one week): FCU, IMG, JAG, OSK, REI/UN and UWE.

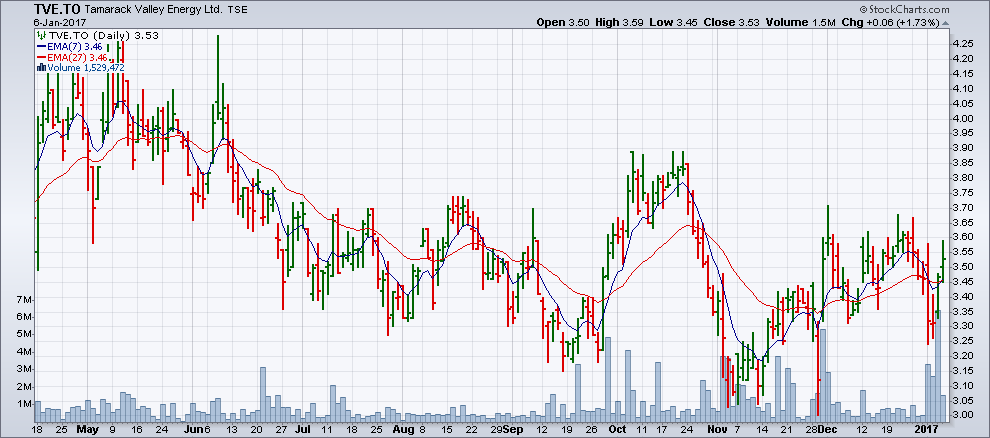
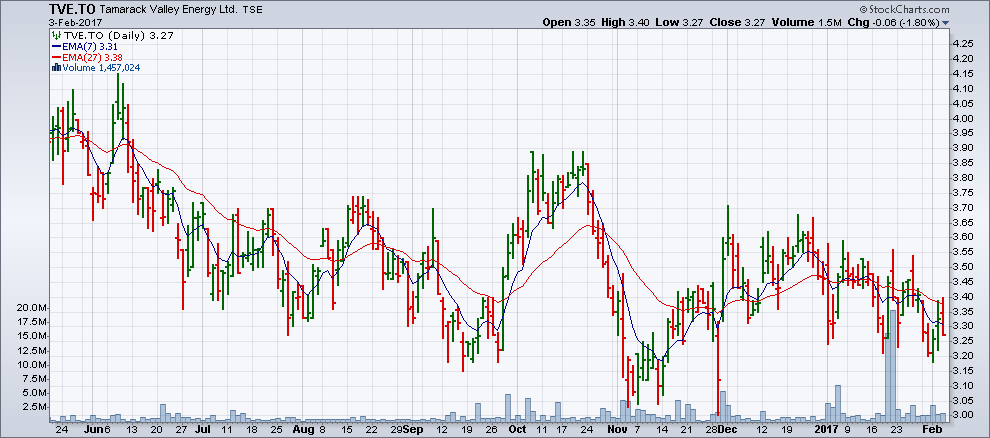
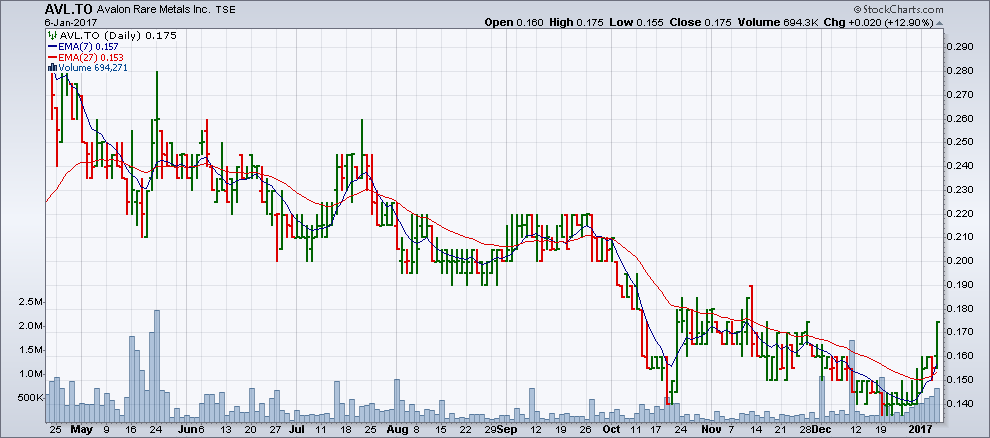
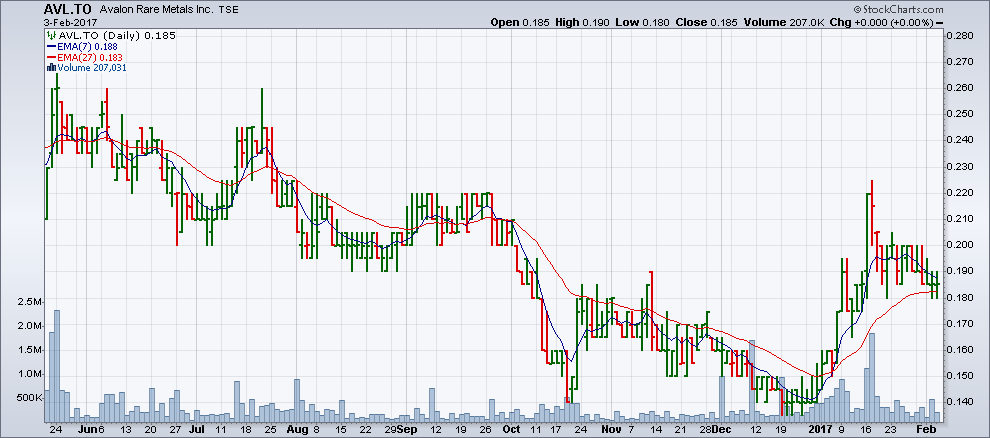
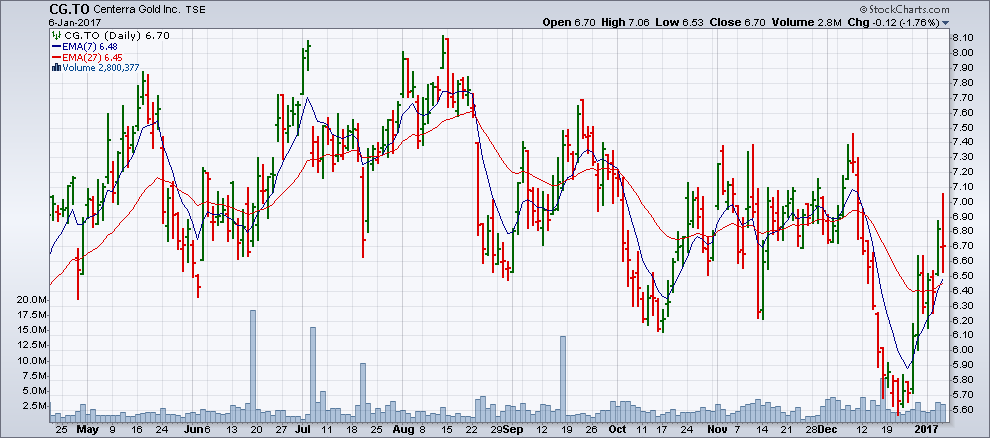
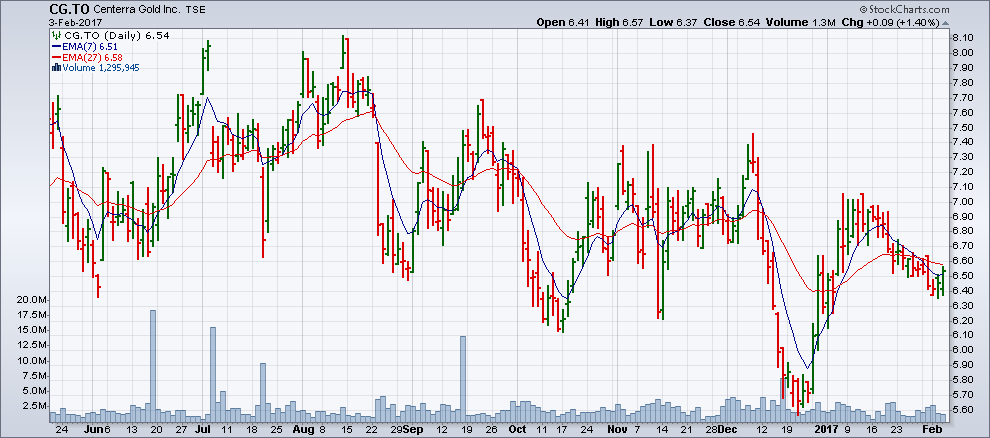
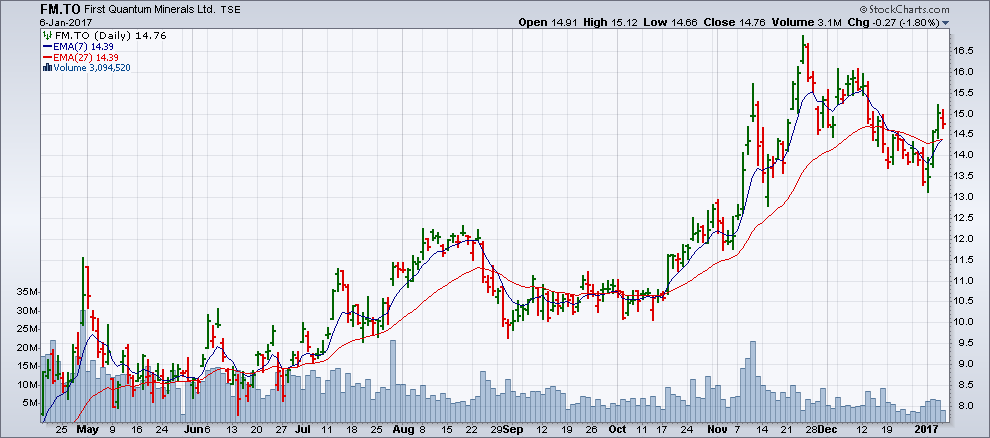
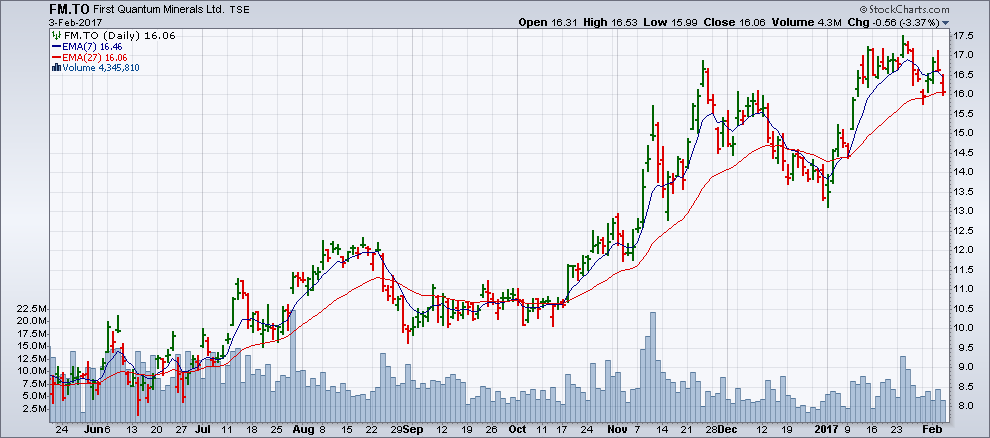
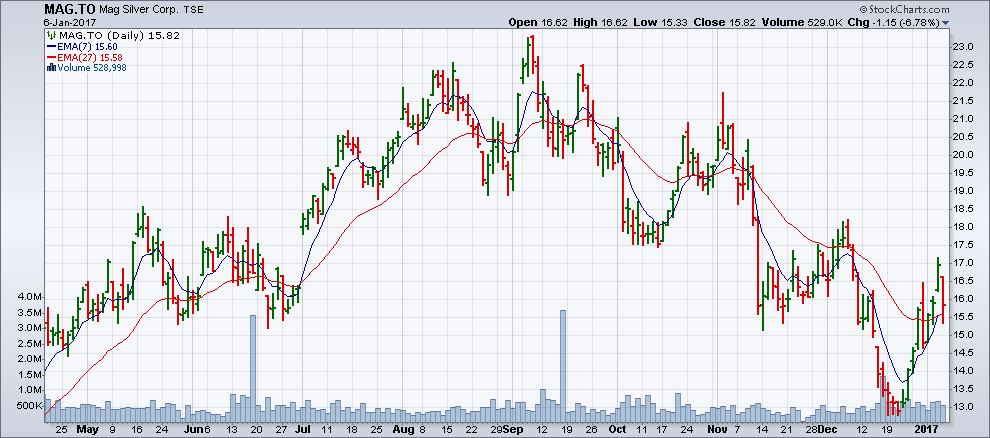
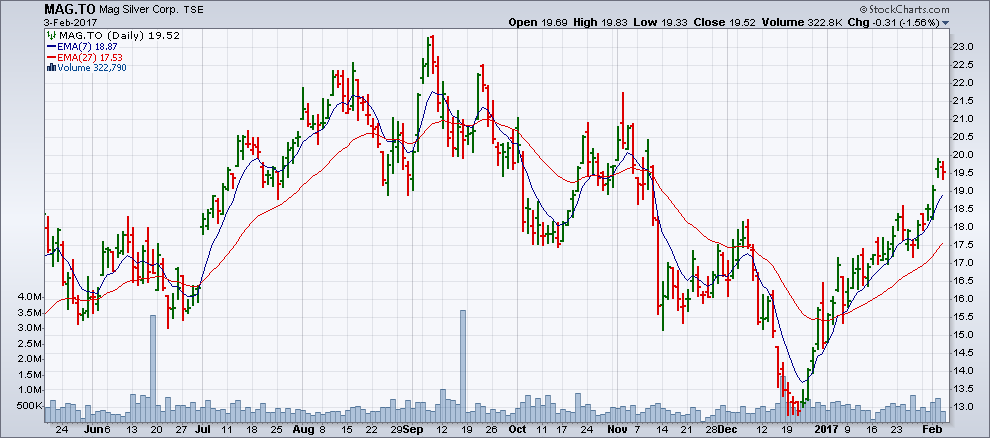
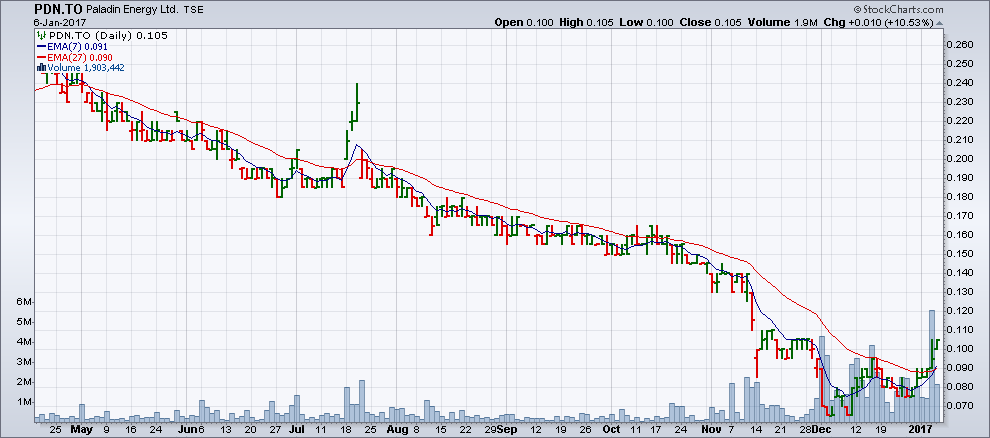
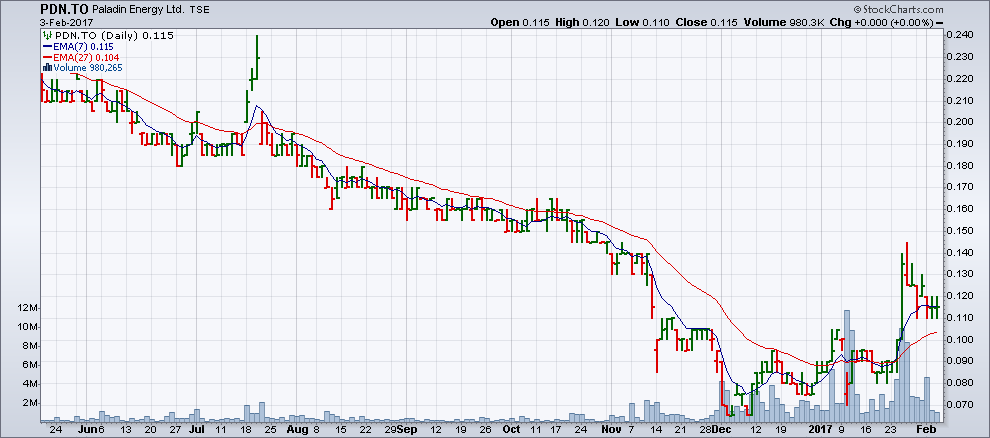
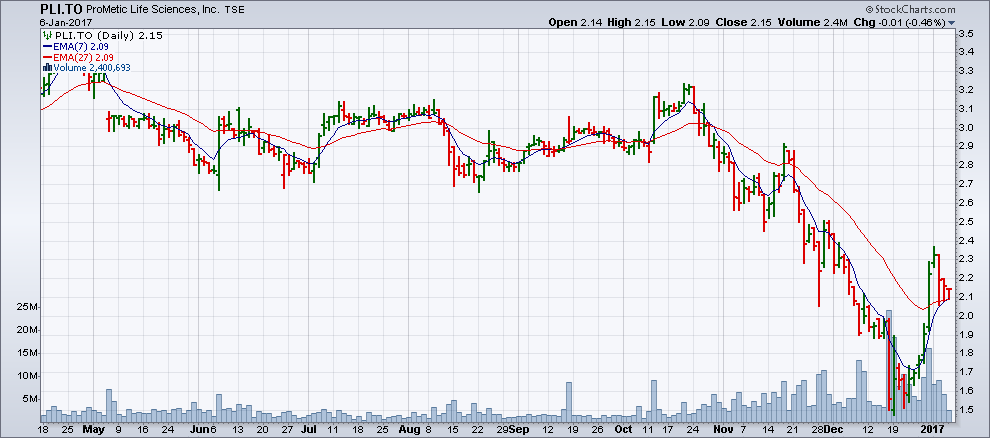
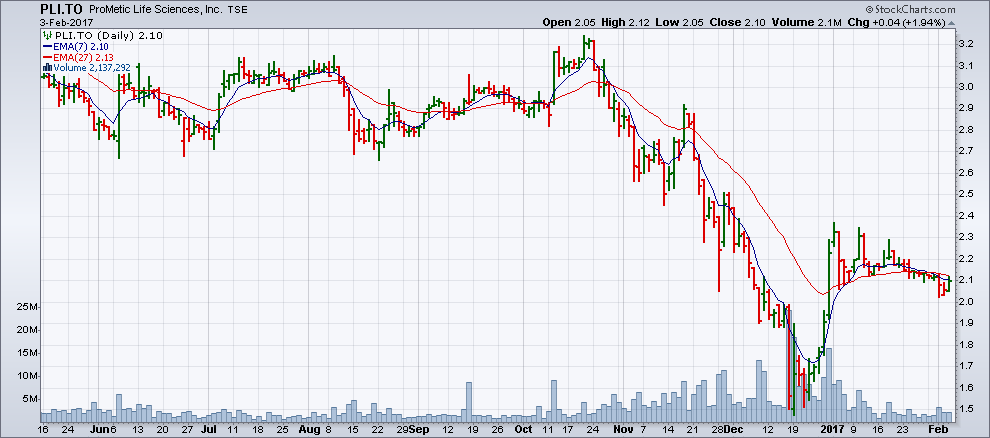
Daily buy signals (each bar represents one trading day): AVL, CG, FM, MAG, PDN, PLI and TVE.

What happened to these 13 stocks? For each of them, you will find here two comparative charts: the first illustrates the situation on January 6, 2017 and the second, on February 2.

To interpret the weekly charts adequately, you should observe the last four bars of the February 2 chart (each representing a week between January 6 and February 2). For daily charts, you should look at the last 20 bars, each representing a trading session.

Comparing the charts of February 2 with those of January 6, we note that seven stock have progressed: they continue to be positively oriented and show a profit, two are neutral (no gain no loss), four (including three dailies) show that the EMAs crossed again to the downside during the month and that it was necessary to liquidate the position, sometimes with a gain and sometimes with a loss, which is generally moderate, by the very nature of the signals.

It should be noted that overall, the gains far outweigh the losses.

It should also be noted that we must adhere to the signals: a theoretical purchase on January 6 was followed by a sell signal in six cases. Just as we executed the purchase on the basis of the buy signal, we must also sell upon the downward cross of the two EMAs.

Here is a series of stocks that have given a buy signal with EMA7, 27on February 2, 2017. In a month we will judge their effectiveness.

TREND Technical Signals
  Up in the Medium Term Up Over the Long Term
Canadian Market
  • ATH.TO
  • NCA.TO
  • PD.TO
  • CJC.V
  • CTZ.V
  • IDM.V
  • AKG.TO
  • AQN.TO
  • BEP/UN.TO
  • BSX.TO
  • CF.TO
  • DNA.TO
  • EDR.TO
  • G.TO
  • MFI.TO
  • SEV.TO
  • CSR.V
  • CUZ.V
  • EGT.V
  • FSW.V
  • HPQ.V
  • ICG.V
  • MIT.V
  • MXL.V
  • NX.V
  • RHT.V
  • RLV.V
  • TVI.V

FCU.TO (weekly)

Chart from January 6:
Chart from January 6
Chart from February 2, in which the last four bars indicate the progress:
Chart from February 2, in which the last four bars indicate the progress

IMG.TO (weekly)

Chart from January 6:
Chart from January 6
Chart from February 2, in which the last four bars indicate a rather neutral position:
Chart from February 2, in which the last four bars indicate a rather neutral position

JAG.TO (weekly)

Chart from January 6:
Chart from January 6
Chart from February 2, in which the last four bars indicate a neutral position:
Chart from February 2, in which the last four bars indicate a neutral position

OSK.TO (weekly)

Chart from January 6:
Chart from January 6
Chart from February 2, in which the last four bars indicate the progress:
Chart from February 2, in which the last four bars indicate the progress

REI/UN.TO (weekly)

Chart from January 6:
Chart from January 6
Chart from February 2, in which the last four bars show that the EMA7, 27 averages crossed downward:
Chart from February 2, in which the last four bars show that the EMA7, 27 averages crossed downward

UWE.TO (weekly)

Chart from January 6:
Chart from January 6
Chart from February 2, in which the last four bars indicate the progress.

AVL.TO (daily)

Chart from January 6:
Chart from January 6
Chart of February 2, in which the last 20 bars indicate progress:
Chart of February 2, in which the last 20 bars indicate progress

CG.TO (daily)

Chart from January 6:
Chart from January 6
Chart from February 2, in which the last 20 bars show that the EMA7, 27 averages crossed downward:
Chart from February 2, in which the last 20 bars show that the EMA7, 27 averages crossed downward

FM.TO (daily)

Chart from January 6:
Chart from January 6
Chart of February 2, in which the last 20 bars indicate progress:
Chart of February 2, in which the last 20 bars indicate progress

MAG.TO (daily)

Chart from January 6:
Chart from January 6
Chart of February 2, in which the last 20 bars indicate progress:
Chart of February 2, in which the last 20 bars indicate progress

PDN.TO (daily)

Chart from January 6:
Chart from January 6
Chart of February 2, in which the last 20 bars indicate progress:
Chart of February 2, in which the last 20 bars indicate progress

PLI.TO (daily)

Chart from January 6:
Chart from January 6
Chart from February 2, in which the last 20 bars show that the EMA7, 27 averages crossed downward:
Chart from February 2, in which the last 20 bars show that the EMA7, 27 averages crossed downward

TVE.TO (daily)

Chart from January 6:
Chart from January 6
Chart from February 2, in which the last 20 bars show that the EMA7, 27 averages crossed downward:
Chart from February 2, in which the last 20 bars show that the EMA7, 27 averages crossed downward