Basic Technical Analysis
Fundamental analysis is the search for securities that are undervalued relative to their assumed real value. I use the word "assumed" because it implies that we have studied companies in terms of their financial ratios, growth prospects, markets and the framework of the economy in general. It is complex work that requires extensive knowledge of the interpretation of financial statements, market sectors and global economic growth, and must be dynamic enough to adapt to all kinds of events which may alter a previous analysis. However, one person rarely has the time and knowledge required to cover all of these aspects. In most cases, this analysis is the result of a team consisting of economists and financial analysts working at financial institutions.
Technical analysis assumes that institutional investors - managers of investment funds, pension funds and private wealth - are, as much as is possible, rational beings. The market therefore expresses prices that are the fruit of institutional managers' analysis and processing talent.
What about the financial power of private investors, individuals who buy and sell securities in their RRSPs, TFSAs or margin accounts? Their influence is far from equivalent to that of institutional investors, who invest millions upon millions of dollars.
The market price of a stock represents the balance between buyers and sellers, between all the reasons that constitute supply and demand. A series of prices reflects the market's trend: flat, upward or downward.
Technical analysis doesn't attempt to understand why a stock is up, down or flat. It simply acts as a "thermometer" of price behavior.
We can choose from several tools that act as thermometers. The basic tool, unavoidable and relatively simple, is the moving average, specifically the exponential moving average (EMA).
Personally, I use a fast EMA of 7 periods and a slow one of 27 periods. A period can cover one session (daily), a week of sessions (weekly) or two minutes within a session (intra-session).
The signs of the start of a trend appear when the two exponential moving averages intersect:
- If the 7-period EMA rises to cross the 27 period EMA, we have a buy signal;
- If the 7-period EMA drops to cross the 27 period EMA, we have a sell signal.
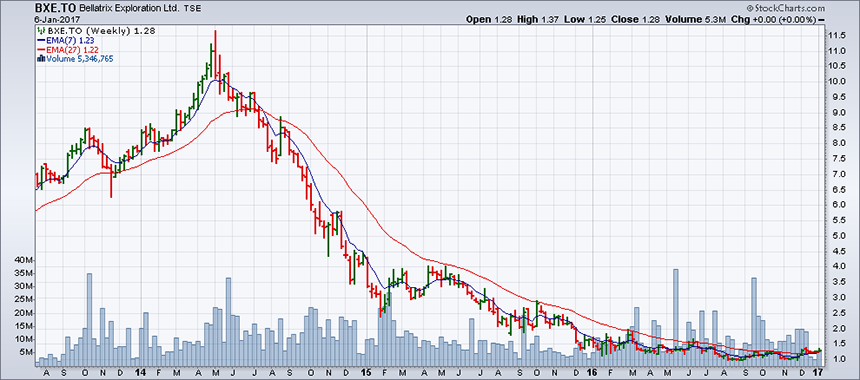
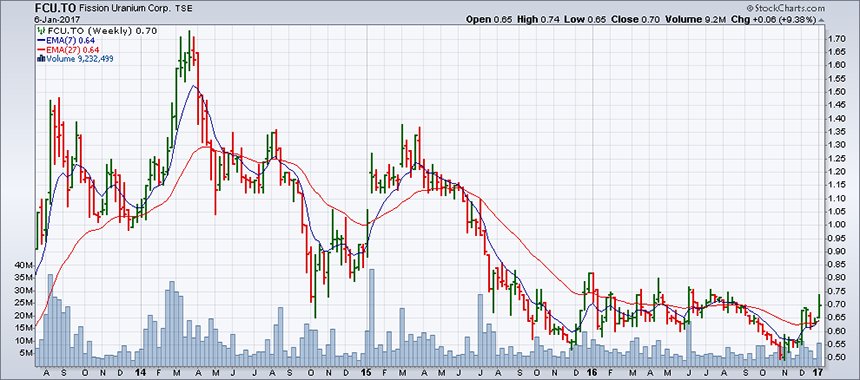
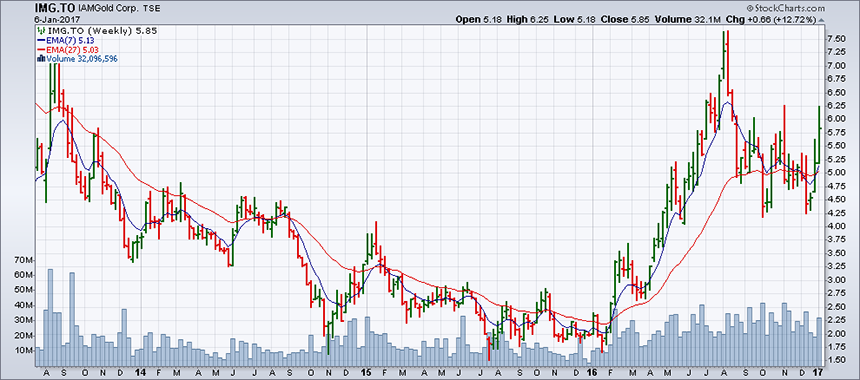
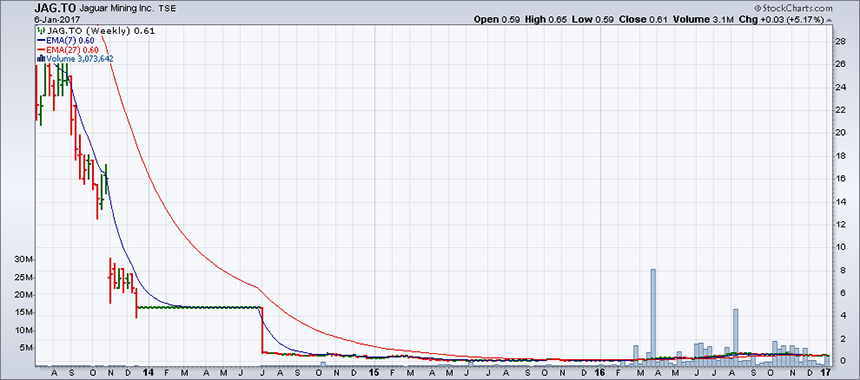
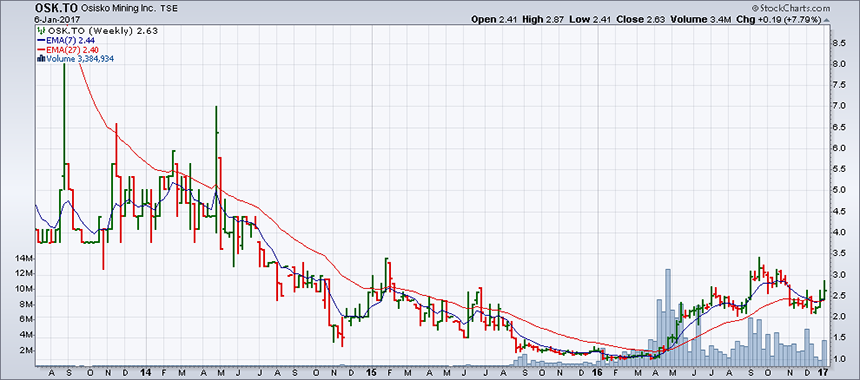
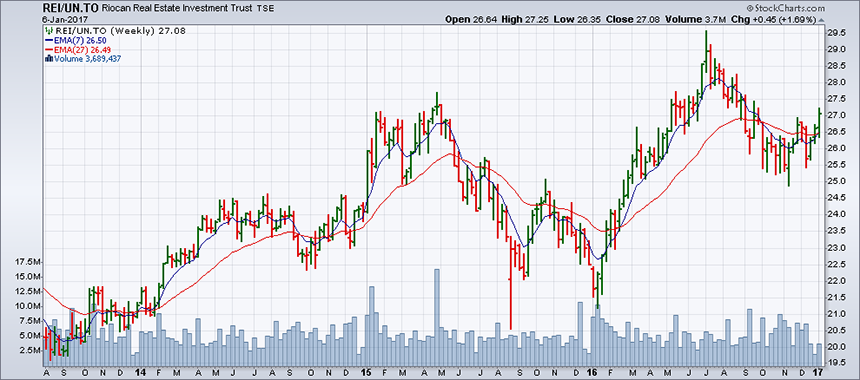
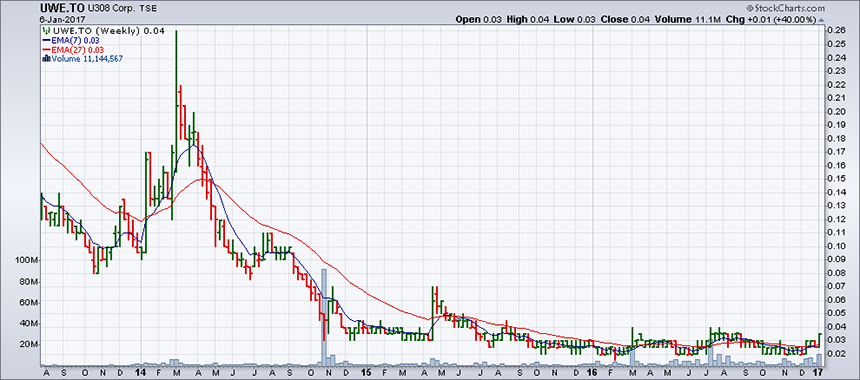
Below is a sample of the application of this method on charts dated Friday, January 6. On that day, the following seven TSX stocks gave long-term (weekly) buy signals with the upward crossing of the two exponential moving averages: BXE, FCU, IMG, JAG, OSK, REI/UN and UWE.
The weekly charts for these stocks illustrate these averages. As a result, at the time of writing on Friday, January 6, the two averages crossed at the close of the first week of trading in 2017. Technically, they indicated a buy signal.
Within a week or more of publication, and thereafter, investors will be able to tangibly see whether this method of technical analysis yields positive results.
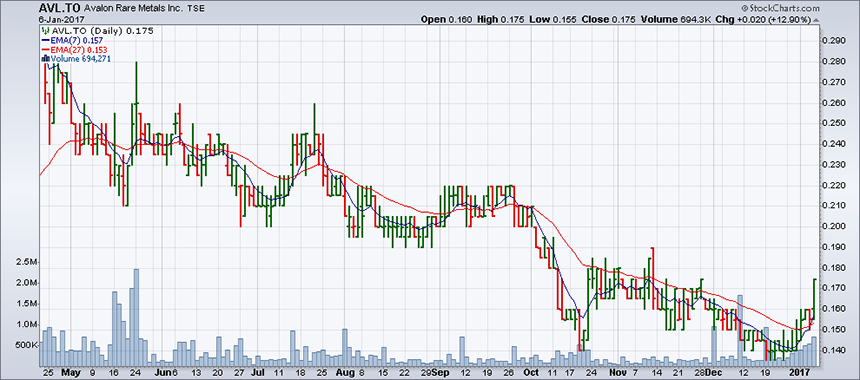
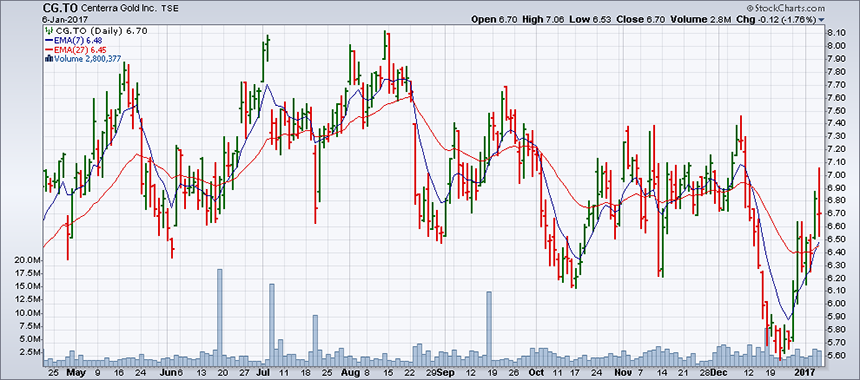
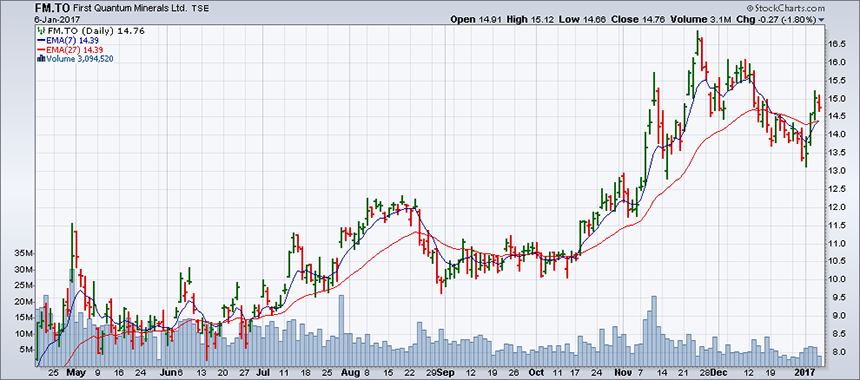
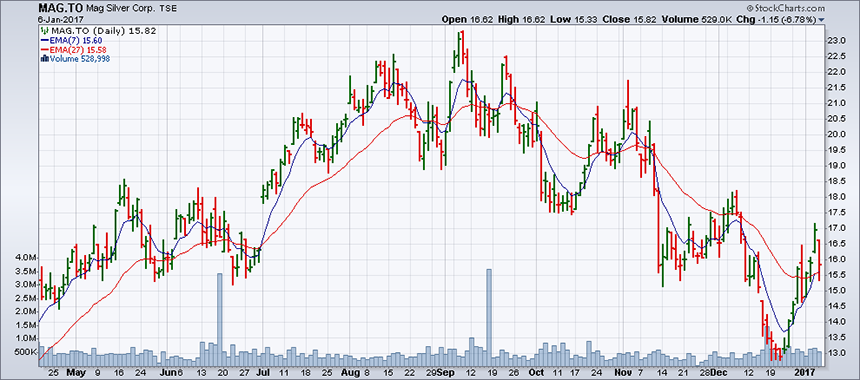
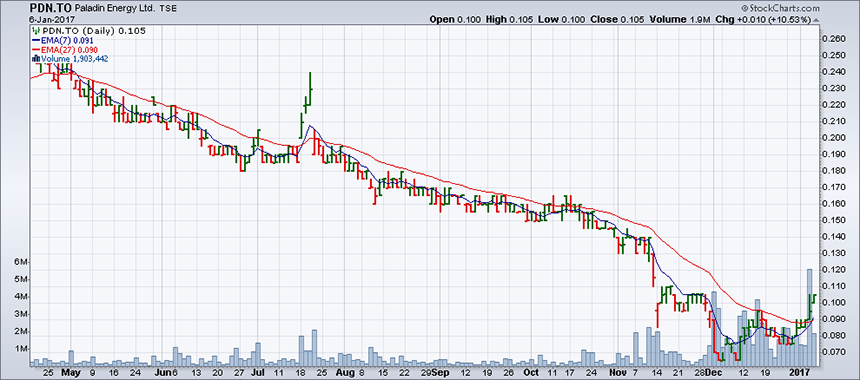
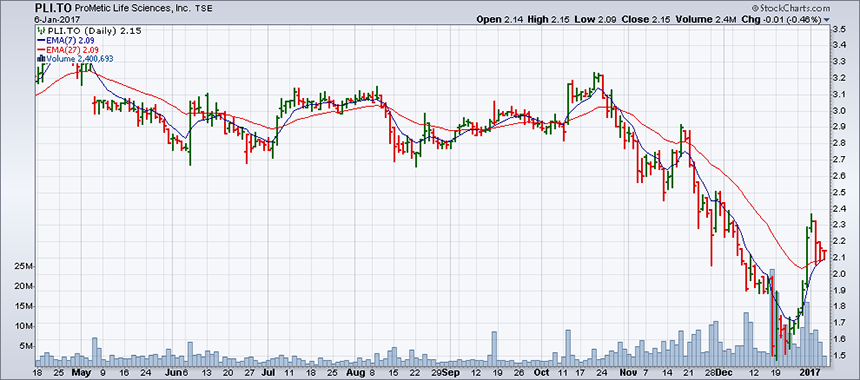
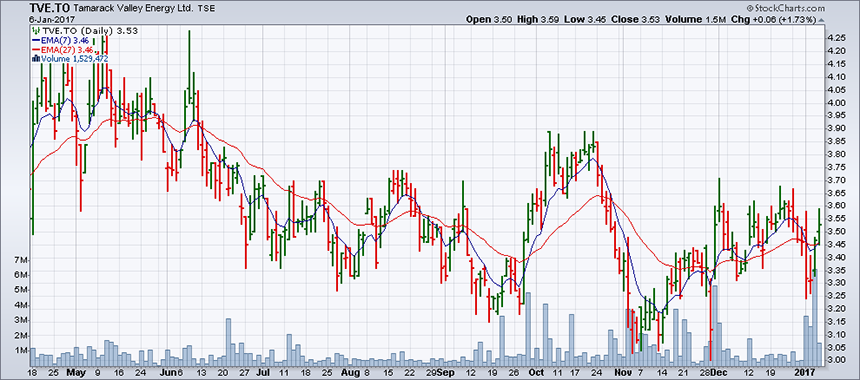
In the shorter term, also on Friday, January 6, the 7 and 27 period EMAs (on daily charts) gave a buy signal for the following seven stocks listed on the TSX: AVL, CG, FM, MAG, PDN, PLI and TVE.
Caution: These technical buy signals are not an invitation to invest in these securities. In fact, this article will appear after January 6 and the signals will have aged by that time. An essential rule of technical analysis is that a signal must be obeyed when it occurs and not later, because it implies the start of a trend, but no one can predict the duration of this trend. In other words, seeing that a security actually rose from the date of a signal does not mean that the trend will necessarily continue.
Apart from the signals generated on Friday, January 6, readers can see that the 7 and 27 EMA crosses produced very good buy and sell signals (or the end of trends) for most of the 14 stocks in the charts below.
As these charts show, the quality of the signals is better when a stock is not too volatile, that is to say when it does not change direction abruptly. This is because, due to their structure, the two exponential moving averages are slow to adapt to changes in stock direction, but they give very good results when these changes occur slowly.