Momentum: The Most Classic Indicator
Technical analysis offers an extraordinary basket of tools, providing investors with what they need as long as they know how these instruments work. One very useful instrument for getting ready is the Momentum (or Mom). The Mom is the "father" of indicators, a true classic.
The Mom formula is very simple: it is the difference between the closing price of today's session and that of a preceding session. For example, if the XIU (the exchange traded fund that reflects the behaviour of 60 Canadian blue chip stocks) closes today at $66.75, and if the closing 12 sessions ago (approximately two-and-a-half weeks ago) was $66.25, the difference is +$0.50. This value is positive because the current closing price is higher than the preceding one. If the previous close had been $67.00 (implying that the current close is lower), the difference would have been negative: –$0.25. At each new session, we subtract the closing price of 12 sessions ago from the current close. The Mom is thus a moving difference between two prices, advancing by a fixed interval of time (or frequency).
The frequency of 12 in these examples is not obligatory. There exists software that offers frequencies of 12 or 20; other software leaves the choice to investors. As a rule of thumb, a frequency exceeding 20 makes the Mom less sensitive and thus not very useful, whereas at less than 12 the Mom is over sensitive.
The chart below shows an example of a Mom-12 applied to theXIU. The ETF bar chart appears above and the Mom below.
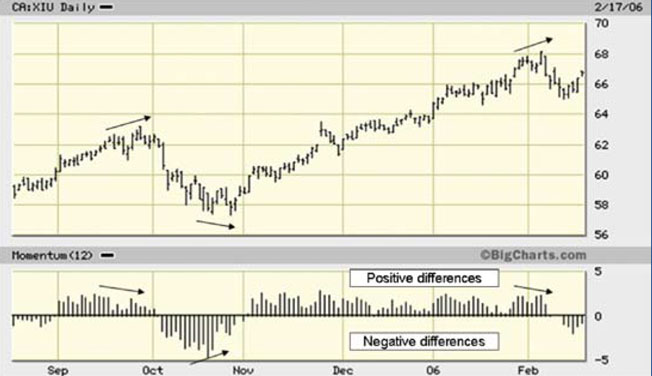
The Mom is shown by means of a horizontal line (0), a positive scale (from 0 to 5) and a negative scale (from 0 to –5). Originating from the zero line are daily vertical bars that indicate positive (above the horizontal line) or negative (below the same line) differences.
The Mom cannot tell you when to buy or sell, but it can show that a current trend, despite apparent strength, is tired or spasmodic. A true sign of when to buy or sell will be provided a little later by other tools such as the moving average cross-over method or graphic configurations. Reading the Mom is simple: it is based on the visual divergence between Mom trends and price trends. When they go in divergent directions, this anticipates a change in the current trend. Examples are easy to find.
In the above chart, we can observe at least three divergences, each one anticipating a change in the direction of prices.
In September the direction of the Mom is downward, whereas the trend of the XIU is still rising. The price falls significantly after its last peak, near the end of September.
In October, whereas the price is still falling, the Mom is already trending upward, anticipating a significant rise that will last until February. In February the price reaches another peak, whereas the Mom is already pointing downward, anticipating the end of a long trend. The Mom sometimes remains silent: it shows little divergence despite a coming change in price trends. But when the divergence is clearly visible the probability of an imminent change in the trend is high.
Sometimes the Mom shows a divergence but the new direction in prices is slow to appear. For this reason the Mom is a tool to be used only for getting ready and staying alert, not an invitation to buy or sell at the moment of divergence.